Contents
- Index
Reverberation Time (RT-60)
Reverberation Time
The Reverberation Time utility allows you to measure and analyze the reverberation decay time and spectral characteristics of an acoustic environment. Reverberation is the sound you hear after an initial burst of energy. This measurement, called RT-60 is a standard method of characterization for concert halls and auditoriums and is the time it takes the sound to decay to 60 dB below its original level.
The Reverberation utility includes an internal pink noise generator which provides the stimulus for the RT-60 measurement. It must be connected from the D/A output channel (see Output Device Settings) through a power amplifier to a high-quality loudspeaker in the room. Typically only one loudspeaker is used for the test (rather than an array of speakers). The amplifier output level should be adjusted so that it is loud enough to "saturate" the environment because the louder the initial sound, the more accurate the resulting RT-60 curves; however, the level should not be so high as to clip the power amplifier or produce distortion from the loudspeakers.
During the test, no operator intervention is required. The computer performs all the ncessary steps to produce a family of decay curves across the audio band. First it activates the noise source long enough to saturate the environment (that is, an equilibrium is reached between direct and reverberant sound throughout the room). Then the sound is turned off and the decay of the signal captured and the reverberation response analyzed in detail.
To use an signal source other than the internal pink noise such as a ballon pop or gunshot follow the steps below:
1) Use the Recorder mode to capture the signal and subsequent decay.
2) Examine the waveform using the Time Series plot and graphically select the signal and the decay; to do this click the selection arrow and then click and drag the mouse across a range of time. When the mouse button is released, the selected time segment will be shown with inverse video.
3) Right click on the plot and select the "Compute and Display RT-60" menu item.
4) The Reverb Time utility will open and the results computed and displayed.
5) You can fine tune the time at which the utility will start the decay time calculation by changing the value in the Start Offset control on the toolbar or by right clicking on the decay plot at the desired time offset and selecting the "Set Decay Start Time" menu. This will recompute the results based on the new decay start point. The offset can also be set in the reverberation options dialog box.
Once the reverberation signal has been captured and analyzed, a series of plots can be ploted, printed and stored to disk. Right clicking on the plot will also popup a menu of options allowing you to place the data or plot image on the clipboard for use in other applications.
Reverberation Plots
Reverb Times - this is a bar graph of reverberation time versus frequency band. 1/3 Octave bands from 80 Hz to 20 kHz are available. In addition a "wideband" or broadband value is shown on the right side. The analyzer defaults to displaying the RT-60 decay time; however, you can change this to display the decay time for RT-10 through RT-60 by using the associated control on the toolbar. In addition double clicking on one of the bars will show the Reverberation Decay plot for the selected frequency band.
Reverb Decay - this is a graph of the reverberation decay versus time for a specific frequency band. You can change the selected frequency band using the associated control on the toolbar and you can change the displayed time limit by using the associated control on the toolbar; this allows you to zoom in to plot the early decay time for instance.
3-D Surface - this is a 3 dimensional surface plot of the reverberation decay; it shows the reverberation response for all frequencies in a single plot. Double clicking on the plot will display the decay plot for that particular band. You can also adjust the displayed time limit by using the associated control on the toolbar.
Reverberation Options
The reverberation options dialog box can be activated by clicking on the "Options" button along the right side of the plot area. This dialog box allows you to can change the color scheme used for the various plots as well as a number of other useful options:
Plot Top - this sets the uppermost point for the amplitude axis in both the Reverb Decay Plot and the 3-D Surface Plot.
Plot Range - this sets the overall range for the amplitude axis in both the Reverb Decay Plot and the 3-D Surface Plot.
Frequency Resolution: You can select either 1/1 Octave of 1/3 Octave.
Maximum Decay Time - this controls how long the analyzer will "listen" for the reverberation decay signal. This value should be set so that it is greater than the maximum expected decay time (you can always zoom in to display a shorter time period). Setting it to a longer time than necessary will not cause a problem but will require additional processing time and also increase the reverb file size. This value defaults to 4 seconds.
Decay Start Time Offset - this allows you to make small adjustments to the initial start point for the decay calculation. Some technicians prefer to ignore the first 100 milliseconds or so of the initial decay. This value can be set directly using the associated toolbar control, in the reverb options dialog box, or by right clicking on one of the Decay plots at the desired time offset and selecting the menu command "Set Decay Start Time". If the offset is non zero you can right click at anytime and select "Clear Decay Start Time Offset" to reset the offset back to zero.
Clear offset when test is run or file is loaded - automatically sets the decay start time delay to zero whenever a new test is run or existing reverb file is loaded.
Extrapolation Method - in a typical acoustic test, it is rare that the difference between the pink noise level and the ambient background level is 60dB or more and because of this we must extrapolate the actual RT-60 time from the earlier decay times. This allows you to change the extrapolation method between RT-10, RT-20, and RT-30. RT-20 is the default setting. If you change this setting, the reverb times will be recomputed and the Reverb Time plot updated.
Smoothing Method - because of the complex nature of reverberation, the response often contains both diffuse reverberation as well as strong reflection components from hard surfaces. The resulting decay plot may appear quite irregular and it is useful to employ smoothing techniques to achieve a better estimation of the reverberation time. You can disable smoothing by choosing "None" or choose between "Average" and "Schroeder". The Average method is a 100 msec moving window that is applied to the decay data. The Schroeder method applies a reverse integration to the decay data starting at the RT-60 time and working backwards in time. The analyzer defaults to using the Average method. If you change this setting, the decay data will be recomputed and the displays will be updated.
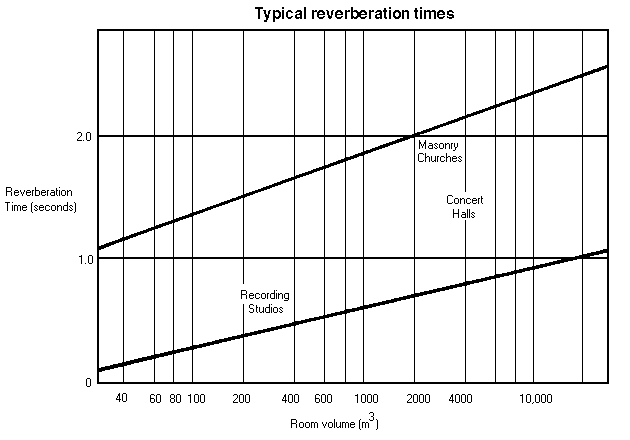
Typical Reverberation Times - the following plot shows the typical RT-60 times for various environments.
Notes:
The reverberation data is "normalized" so that the actual starting amplitudes are all adjusted to 0 dB. You may find that if you do not have sufficient signal amplitiude at certain frequencies, the decay curve for these frequencies will appear almost as a flat line with little or no decay.
The analysis method used in this utility has a 10 millisecond resolution. This resolution is not affected by the maximum decay time parameter or any other setting.
See Also: Right Click Action Menus