Screenshots
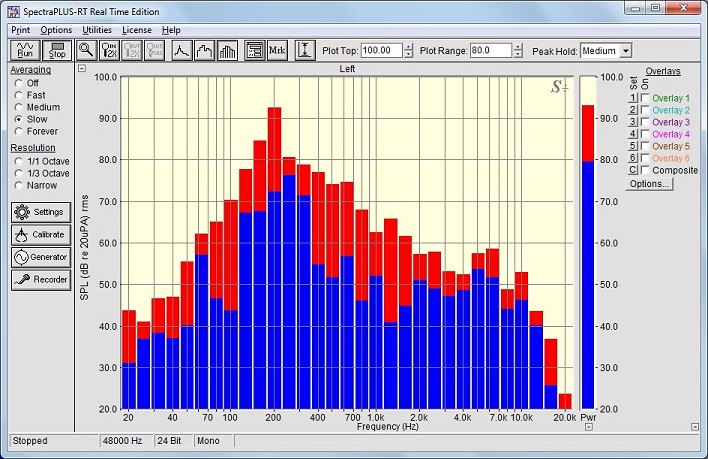
The screenshot below is of the main application window
for SpectraPLUS-RT. All the frequently used settings are available on the sidebar for
quick access - it is exceptionally easy to use.
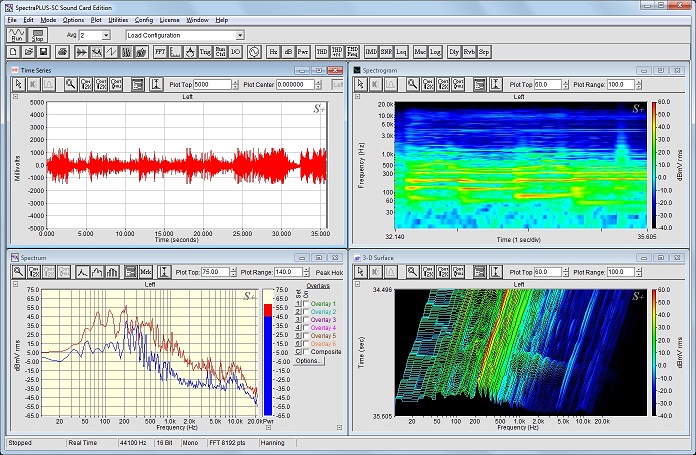
The screenshot below is of the main application window
for SpectraPLUS-SC. All the
frequently used menu commands are now available on the toolbar for
quick access. Test configuration files can be loaded directly from
the toolbar and multiple plots can be viewed simultaneously - it is
exceptionally easy to use.
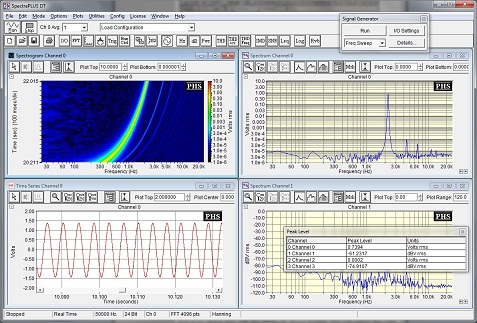
The screenshot below is of the main application window for SpectraPLUS-DT.
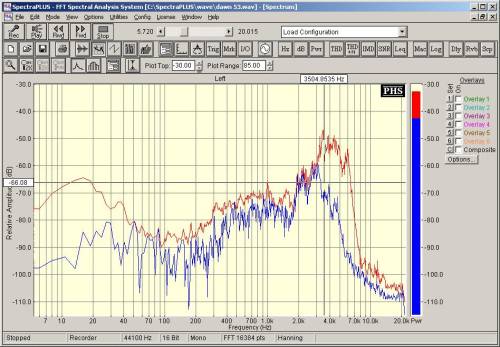
The screenshot below is of the Spectrum Display. This display is the
workhorse of the analyzer and we have highly optimized its
performance for quick updates and made it exceptionally easy to use.
The example below shows several "overlays" where previous
measurements have been saved and displayed together with the current
spectrum. In addition, a differential cursor measurement are shown.
You have complete control over scaling and labeling for all axis.
The overlays can be saved and recalled from disk and labeled to meet
your needs. This display is very fast - download the program and try
it yourself!
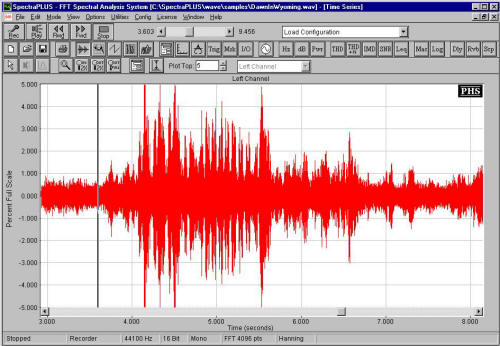
The screenshot below shows the Time Series display. Editing is
supported in the Recording or Post Processing modes and full cursor
measurements are provided.
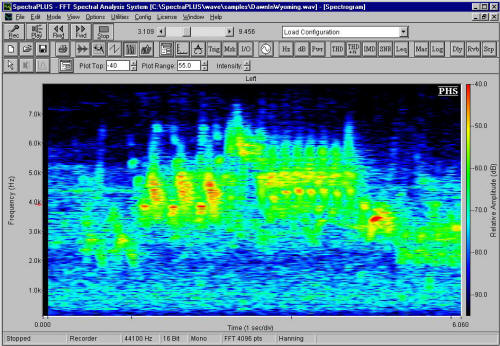
The screenshot below is of the Spectrogram display. This display
shows the spectrum versus time with the amplitude shown in color.
You can select the color gradient, scroll direction and many other
parameters. Cursor measurements are supported on all axis. This
display is one of the finest spectrograms available for the PC.
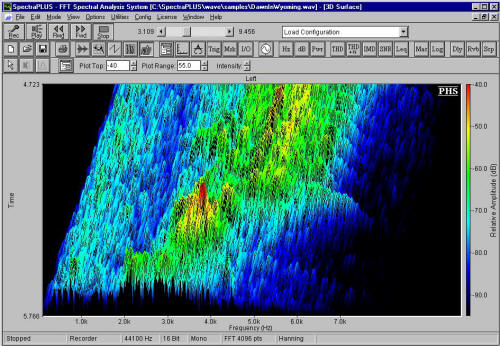
The screenshot below is of a 3-D Surface plot which shows a
perspective view of the spectrum versus time.
